How to read the Assessment Analysis Report
This report is using an "item analysis" process where the "items" are questions.
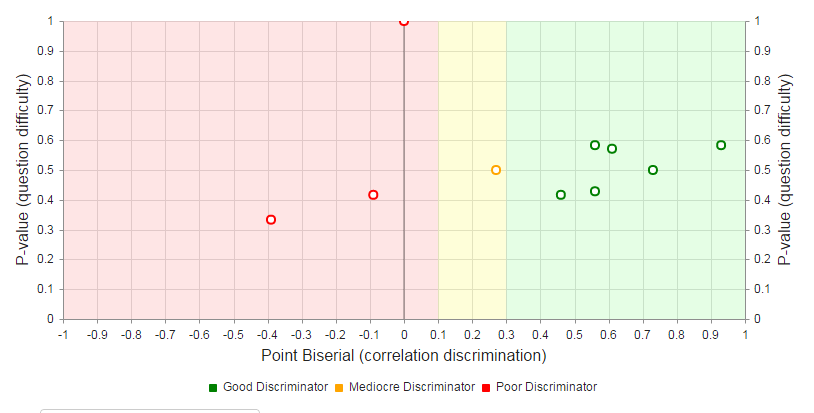
- P-Value (item difficulty): Measures how often learners get that question correct and ranges from 0.0 to 1.0, where higher values indicate that the question is easier.
- Point-biserial (correlation discrimination): Generally, the goal of an assessment is to discriminate between those who have learned the subject matter and those who have not. The point-biserial (correlation discrimination) value measures how well that question discriminates between those two groups of learners. We calculate this with a correlation between how often learners get that question correct in relation to how each learner did on the assessment overall. This is why the value is often referred to as the correlation discrimination.
- Example: If most of the learners who scored well on the assessment got question A correct, and most of the learners who did poorly on the exam got question A wrong, then that question would have a high point-biserial value. On the other hand, if a question was often answered incorrectly by learners who did well on the exam overall, then it would have a low point-biserial value. A question with a low point-biserial is an indicator that your learners who know the subject matter well are struggling with that question.
- Values range from -1.0 to 1.0, with values above 0.2 being ideal. Note that this threshold is somewhat arbitrary, as literature varies slightly on a recommended threshold, but they all agree that a higher point-biserial is generally better. Very low or negative point-biserial values can be an indicator of one of many potential problems with the question:
- The material the question covers may not have been taught in the course material and/or was delivered poorly.
- The question's choices may have the wrong choices marked as correct.
- The wording of the question may be confusing to your learners that know the material well.
- More than one choice may be defendably correct in the eyes of learners that know the material well.
- The question may be too hard or too easy, which can be identified by its P-Value. If everyone gets a question right, then it does not discriminate well.
- The material the question covers falls outside the subject area of the overall exam.
- You must be careful when performing this analysis across questions that cover different subject areas. If an exam on chemistry includes a small number of biology questions, then those biology questions may appear to be poor discriminators. Students who studied the chemistry material will do well on the overall exam, but may get the biology questions wrong. In this case the biology questions will have a low point-biserial, even though the questions themselves might be well designed. To mitigate this effect, use the Objective and/or Pool dropdowns of the report to narrow your analysis to the largest group of questions of a similar subject area.
- Sample Size: For these values to be reliable, it is important that you have a large enough number of learners who have completed the assessment, as well as several questions to analyze across. With very few responses, the values will not be accurate measurements. With very few questions, the correlation will not be effective. More is always better, but at least 50 responses is recommended. If your assessment is configured to only present a random selection of questions to each learner, then you should have an even greater sample size to ensure each question has a reasonable number of responses.
Note: The report considers only the first attempt from each learner.